



Nasdaq Still Eerily Tracking its 1990s Bull Run
By datatrekresearch in Blog
The Nasdaq Comp is closely tracking its mid- to late-1990s playbook, with the current AI-driven rally mirroring the earlier Internet-led bull market in both magnitude and path. While macro shocks (then: Asian Financial Crisis, now: US-Iran conflict) have created similar volatility, history shows geopolitical shocks ultimately find resolution. The larger takeaway is that secular tech bull markets driven by disruptive innovation tend to last longer than investors expect and getting out too early often means missing outsized gains.
Watch it here on our YouTube channel! Please hit like/subscribe and share this video if you find it useful. Sign up on datatrekresearch.com to sign up for a 2-week free trial to our daily investment newsletter!
Transcript
Hi, I’m Jessica Rabe, co-founder of DataTrek Research. In today’s video we have an update on a client favorite chart that shows how the Nasdaq Composite’s rally of the last few years almost exactly follows its mid/late-1990s bull run. Even with the recent pullback from the US-Iran conflict, the Nasdaq is quickly getting back on track.
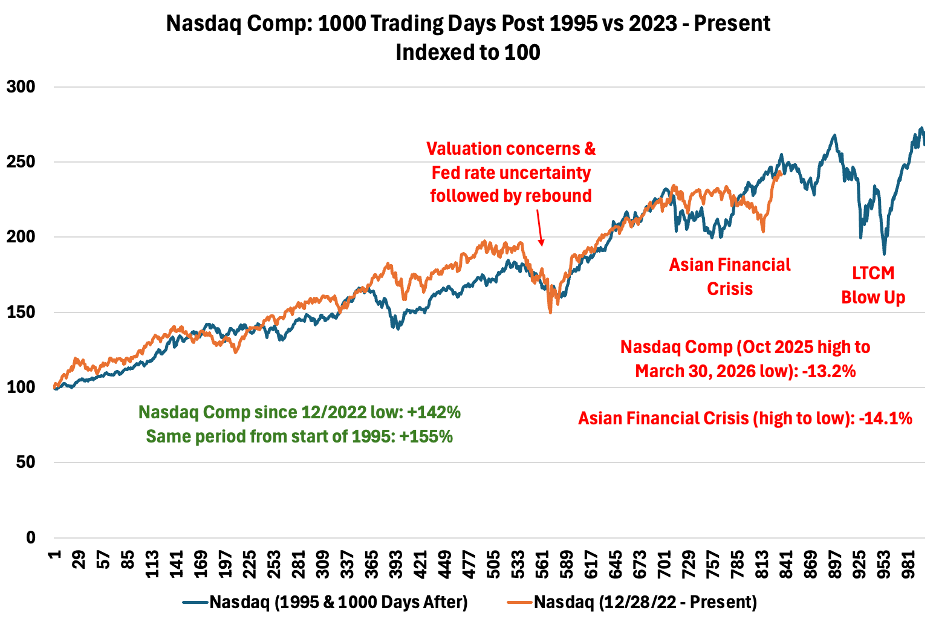
This chart shows an indexed comparison of how the Nasdaq Comp performed in the 1,000 trading days following the start of 1995 through December 1998, marked by the blue line, versus its low on December 28th, 2022 through today’s close marked by the orange line:
Before diving into the latest performance data, we begin our Nasdaq comparison in 1995 and late December 2022, the Comp’s most recent bear market trough, because these bull runs have similar economic and tech-focused setups.
- Like 2022, there was a Fed rate shock in 1994 after a period of low rates in the early 1990s. Even more importantly, neither hiking cycle caused recession.
- More importantly, both rallies were sparked and largely sustained by a new disruptive technology. The Internet started seeing rapid adoption and investor interest in the mid-1990s. For example, the original “Netscape Moment” occurred on August 8th, 1995, when the browser company went public and validated the Internet as a commercially viable and investable platform.
Likewise, ChatGPT launched at the end of November 2022, just before the start of the Comp’s current bull market, igniting enthusiasm for Gen AI.
The Nasdaq Comp has followed its mid-1990s experience to a remarkable degree over the last +3 years, even outperforming at times, and is now recovering after trading almost as poorly as it did during the Asian Financial Crisis in 1997 and 1998. This comparison is a useful case study in how markets discount the risk of a change in economic conditions while also assessing the longer-term payoff of a new disruptive technology.
We have three points on this comparison:
First, today marks the 835th trading day from the Nasdaq’s low in December 2022, and it is up 142 percent since then. On the same day in April 1998, the index was up 155 percent from the beginning of 1995. In other words, the AI trade is thus far almost exactly matching the 1990s Dot Com trade.
Second, the path higher during both timeframes has not been linear. For example:
- The Comp’s tariff-related pullback in April 2025 and subsequent rebound closely mirrored the V-shaped recovery in Q1 and Q2 1997.
- Back then, the Tech rally stalled and turned lower after former Fed Chair Alan Greenspan’s famous “irrational exuberance” speech in December 1996, which caused valuation concerns.
- There was also Fed rate uncertainty given worries about a reemergence of inflation, similar to the last few years.
Third, the Comp was choppy from Q4 2025 through Q1 2026, but it held up slightly better relative to the late-1990s playbook because the underlying drivers were different:
- In the 1990s, the selloff was caused by an exogenous macro shock – an emerging markets currency crisis – whereas more recent pressures started to build from company-specific concerns around AI investment payoffs and elevated equity valuations.
- The recent oil price shock from the US/Iran war hit investor confidence in March, but not quite as badly as the Asian Financial Crisis, for two reasons. First, worries about global financial stability tend to hurt valuations more than any other catalyst because the system is so complex that no one knows how bad things can get. Second, Semiconductor stocks held in well, even during the worst of the recent selloff.
- From the high in October 1997 to the low in late December 1997, the Comp fell 14.1 pct. That compares to a slightly smaller loss of 13.2 pct from the Comp’s high last October to the low on March 30th.
- After the low in December 1997, the Comp rallied 27.9 percent to its next high in April 1998, which happens to line up exactly to today. By comparison, the Comp is up 19.3 pct since the low through today.
As for what comes next, our 1990s playbook is a reminder that the path higher was far from smooth, but investors with a long-term perspective did extremely well.
- The Comp had a correction following its April 1998 high – where we currently are in the comparison – falling 11 percent over the following 37 trading days to mid-June, as fears grew that the Asian Financial crisis was worse than markets had anticipated. It then reversed sharply, rallying by 17.4 pct over the next 24 trading days to late July, as investors reassessed the spillover to the US economy. The Fed was on hold, cheaper Asian imports helped suppress inflation, and the US tech boom was still intact.
- After the late July 1998 high, the Comp was hit by a second and deeper selloff by a new shock. Russia defaulted on its debt in August, and that event cascaded into the near-collapse of highly leveraged hedge fund LTCM, raising fears of systemic contagion. The recovery was swift once the Fed stepped in, organizing a private bailout of LTCM in late September. The FOMC also cut rates in September, October, and November, which reassured markets and sent the Comp surging into year-end and setting the stage for the 1999 to early 2000 rally.
The takeaway here is that macro shocks can still hurt confidence even deep into a secular bull market. This time around, the catalysts could be a Middle East escalation, an oil-driven recession scare, or a Warsh policy mistake. But both episodes in 1997 and 1998 are case studies in the importance of not getting shaken out too early. The shocks were sharp and scary, yet the underlying bull market, driven by a disruptive new technology, ultimately persisted for well over another year. The Comp more than doubled, up 130 percent, from the end of 1998 through the high on March 10th, 2000.
Summing up, we still believe US large cap Tech is in the midst of a secular bull run driven by monetization opportunities around gen AI. The 1990s is a useful example about how momentum can stall when a large macro shock hits but can also quickly recover as policy addresses the problems at hand.This dynamic is on full display in the current cycle with Trump administration generally moving quickly to address market stress, supporting the rally’s resilience alongside the underlying durability of the US economy. While the US-Iran conflict has tested both, history shows geopolitical shocks ultimately find resolution and that is still our base case.
Moreover, US large cap Tech’s strong rebound off the recent lows shows the AI trade remains in full force, rather than simply reflecting bounce from being oversold. Over the long-term, this group tends to outperform because markets consistently underestimate its ability to launch new offerings that power incremental operating leverage and upside earnings surprises. The 90s are a clear reminder of the risk of exiting too early and missing outsized long-term gains from a truly disruptive, secular growth theme.
With that, thank you very much for taking the time to watch this video, please hit like and subscribe if you enjoyed it. And if you'd like to see our daily research, you can start a 2-week free trial on datatrekresearch.com. Thanks again for watching and we hope you have a great day!
