



The Most Important Stocks to Own Right Now
By datatrekresearch in Blog
Oil prices are climbing amid the US-Iran conflict, and that raises a critical question for investors: are you underweight Energy? In this video, DataTrek Research co-founder Jessica Rabe explains how much exposure major global equity benchmarks actually have to the sector. Because Energy is often one of the few sectors that outperforms during an oil shock, maintaining at least a neutral weighting remains a prudent strategy.
Watch it here on our YouTube channel! Please hit like/subscribe and share this video if you find it useful. Sign up on datatrekresearch.com to sign up for a 2-week free trial to our daily investment newsletter!
Transcript
Hi, I’m Jessica Rabe, co-founder of DataTrek Research, and today we have a very quick but extremely important topic to discuss. Oil prices are rising quickly and making new 1-year highs because of the US-Iran conflict, and that makes understanding your Energy sector weightings the most critical issue for stock market investors right now.
Over the last 50 plus years, Energy stocks have always outperformed during periods of heightened Mideast geopolitical tensions and rising oil prices, such as the 1973 Saudi oil embargo, the 1979 Iranian Revolution, and the 1990 – 1991 invasion of Kuwait by Iraq and subsequent Gulf War One. In fact, this group is often the only one to deliver positive returns over such periods.
We have a similar situation developing right now, one where military action may go on for several weeks and push oil prices even higher. Energy weightings could therefore have a meaningful impact on portfolio performance through quarter end and into Q2.
With that, I’m going to briefly run through the Energy weightings for various geographies and investment styles:
Let’s start with global and US equity index benchmarks since this is how most investors measure their portfolio’s performance. We have ranked each subcategory from most to least Energy exposure:
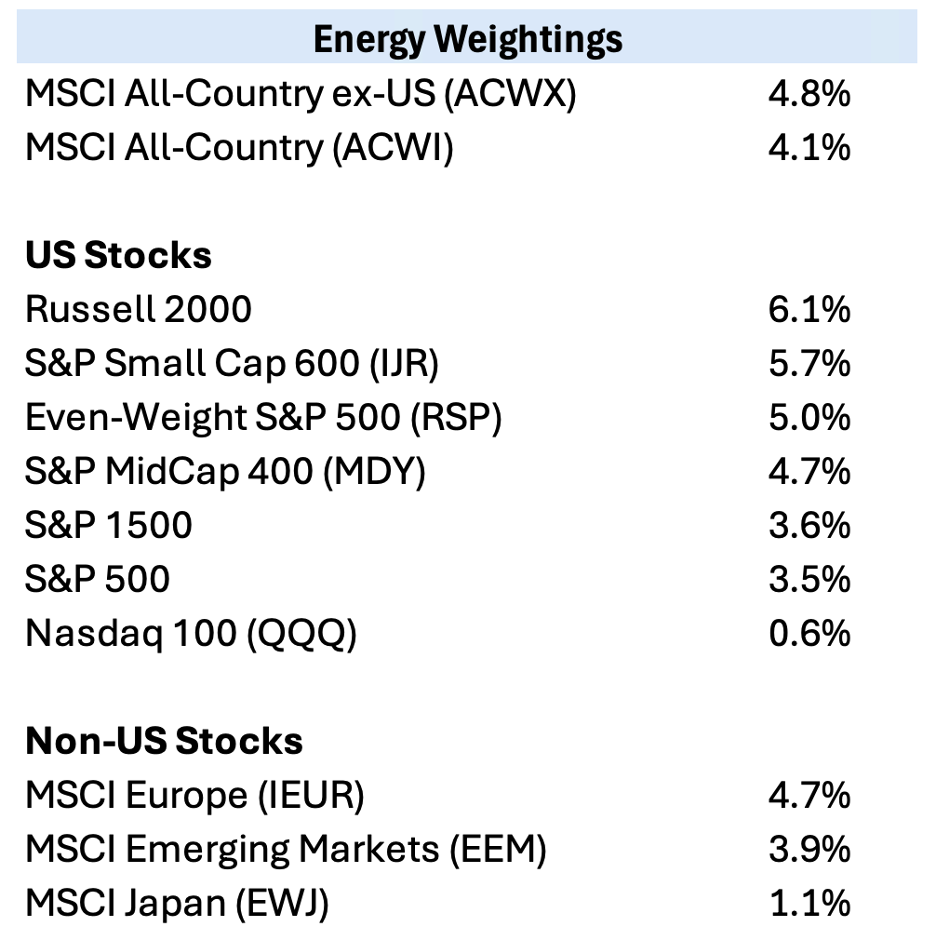
The takeaway here is that the MSCI All-Country index has a 4.1 percent weighting in Energy, which means investors measured against this global equity benchmark should have at least that much exposure to the sector. It’s less for US large cap equity investors, at 3.5 pct of the S&P 500. US mid and small cap equity investors need more Energy exposure, with mid caps at 4.7 pct and small caps around 6 pct. Large cap equal-weight investors are actually in good shape relative to those who own the market cap weighed index, with 1.5 percentage points greater exposure to the group.
For investors benchmarked to just non-US stock indexes, their Energy exposure should be higher, at 4.8 pct for the MSCI All-Country ex-US index. MSCI Europe tilts slightly lower, while MSCI Emerging Markets are underweight Energy. And lastly, MSCI Japan only has a 1.1 pct weight to the group, as it has very little in the way of public Energy companies. If you are wondering how all 3 subcomponents of ACWX can be nominally underweight the group versus the rest of world benchmark, this anomaly is due to the market cap cutoff for that index. Energy companies tend to be quite large, so they have a higher weighting in MSCI All Country ex-US than MSCI Europe, Japan, or EM.
Let’s now look at individual countries, because Energy exposure varies dramatically by geography. This table shows the Energy sector weightings for major non-US single country indexes vs the S&P 500:
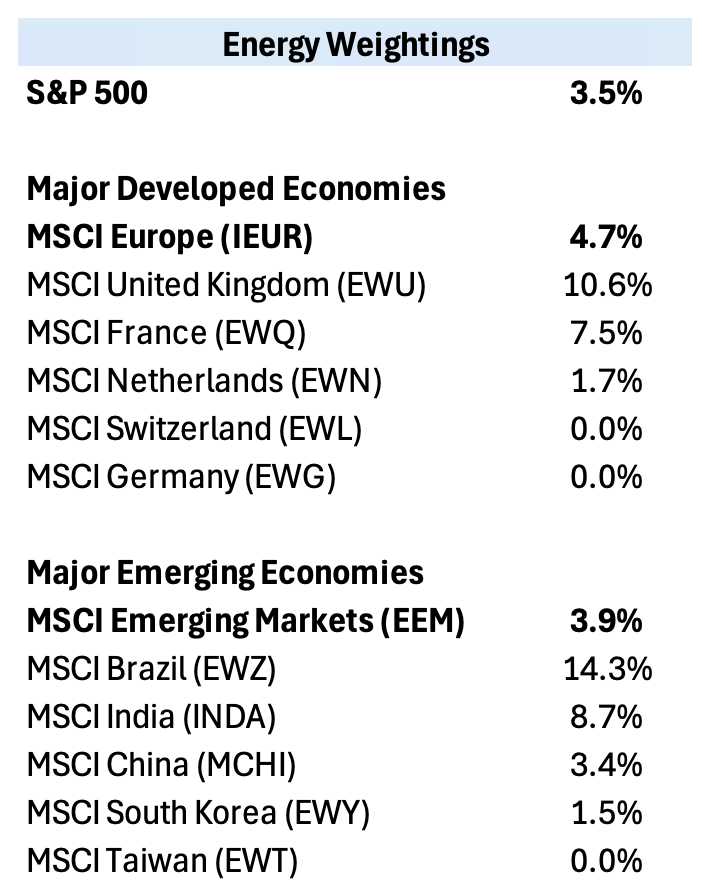
I have two comments here.
First, the UK and France have about triple and double the Energy exposure as the S&P 500. They also have substantially higher Energy weightings than MSCI Europe as a whole. Switzerland and Germany have no Energy exposure, making these country’s equity indexes very vulnerable to rising oil prices. The Netherlands has just a 1.7 percent energy weighting, so not much of an oil price hedge there.
Second, both MSCI Brazil and MSCI India are very overweight Energy relative to MSCI Emerging Markets and the S&P 500. The other important EM single-country market indexes are underexposed to Energy, however, including China, South Korea, and Taiwan.
Third, our last two tables show energy weightings by widely followed US equity investment styles, where the differences are also large.
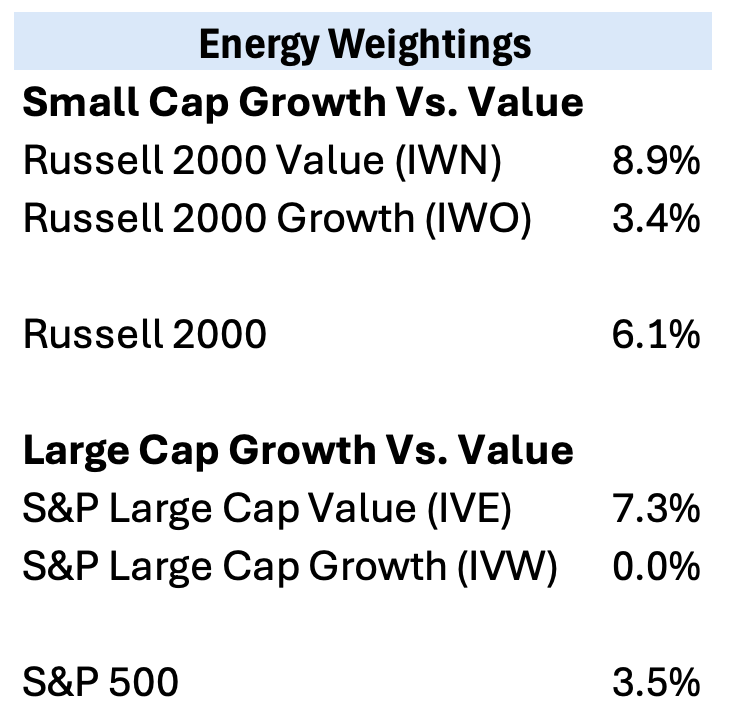
The takeaway here is that Value is overweight Energy in both US small caps and large caps. Large cap Growth has literally no Energy exposure, and small cap Growth is very underweight the group.
And here are some other popular US equity investment styles versus the S&P:
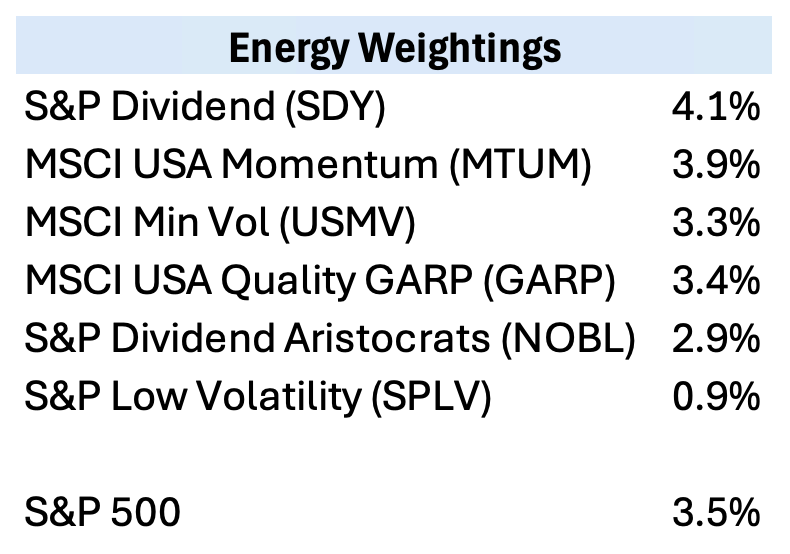
The most important point here is that energy weightings within commonly used US equity investment styles vary widely, even within nominally similar approaches. The Energy exposure for the two most popular dividend-focused investing strategies range from 3 pct to 4 pct. For min-vol strategies, it ranges from 1 pct to 3 pct. Lastly, Momentum has a modest overweight to Energy, while GARP or Growth At a Reasonable Price is slightly underweight the sector.
Our bottom line here is that we have had a long-standing recommendation to hold at least a neutral Energy sector weighting in diversified equity portfolios. Now is the right time to reiterate that view, and this video gives you the data to evaluate if you need to make any changes to your holdings.
With that, thank you very much for taking the time to watch this video, please hit like and subscribe if you enjoyed it. And if you'd like to see our daily research, you can start a 2-week free trial on datatrekresearch.com. Thanks again for watching and we hope you have a great day!
