



These Stock Market Moves Almost Never Happen — Until Now
By datatrekresearch in Blog
We’re seeing some of the most extreme equity market rotations in more than a decade, from US large caps to small caps, from US stocks to non-US equities, and from Semiconductors to Software names. In this video, DataTrek Research co-founder Jessica Rabe explains that US Big Tech’s massive AI spending is at the heart of all these moves, which are hitting 2, 3, and even 4 standard deviations away from historical norms.
Watch it here on our YouTube channel! Please hit like/subscribe and share this video if you find it useful. Sign up on datatrekresearch.com to sign up for a 2-week free trial to our daily investment newsletter!
Transcript
Hi, I’m Jessica Rabe, co-founder of DataTrek Research, and in today’s video I am going to address what is undoubtedly the biggest issue weighing on the minds of many thoughtful investors. Simply put, global and US equity market action over the last 100 days is so extreme that many people think something in the system has broken. If you feel this way, you are not alone.
More importantly, you are not wrong, and I am going to run through 3 examples to prove it. The proof that something dramatic has happened is very clear in equity market return data, whether we’re talking about US Tech Hardware and Software names, domestic versus international stocks, or US large and small caps.
I won’t keep you waiting for an explanation as to why the global stock market has turned upside down over the last few months, so here it is in 3 points:
First, the problem starts with how much capital US Big Tech companies have announced they are spending to build out their artificial intelligence offerings. Over the last few months, we have learned that every hyperscaler is going to spend all their operating cash flow this year on Capital Expenditures on AI buildouts. That has never happened before regardless of what the hot new technology was at the time, and it’s a huge bet on the part of all these companies in an extremely expensive new technology with a very uncertain payoff. At the same time, they don’t really have a choice. None of them want to end up like IBM in the 2000s, missing out on the Internet, or Intel in the 2000s, under investing in mobile computing.
Second, while Big Tech has no choice but to ramp up its CapEx spend, investors can decide they don’t need to hang around and wait to see who wins the science fair. Many of them have made excellent returns in these stocks over the years, so they rightly figure they can afford to park some of their capital elsewhere until the dust settles.
Third and lastly, while AI is still an evolving technology, it is also a clearly disruptive one to many industries. So, in addition to lightening up on Big Tech names, a lot of investors are also selling the stocks of companies most exposed to the disruption created by recently launched AI tools.
With that explanation, let’s dive into our 3 examples of statistically huge moves by comparing the relative performance of US large cap Software and Semi names. This comparison speaks to the issue I was just discussing, namely how the market is very focused on potential losers from AI.
This chart shows the trailing 50-day - about 2 ½ calendar months - relative price returns between Semis (using the SMH ETF as a proxy) and Software (using IGV) from 2015 to the present. When the blue line is above or below the x axis, Semis have out or underperformed Software by the number of percentage points shown on the y axis.

I have three quick points on this chart:
First, Semis and Software performed evenly in the back half of the 2010s, but Semis have widely outperformed since 2020 and especially since 2023:
- Semis went from outperforming Software by an average of just 0.2 percentage points over any given 50 trading days from 2015 to 2019 to beating by an average of +3.6 points since 2020.
- Semis also went from outperforming Software less than half or just 43 percent of the time from 2015 to 2019, to well over half or 58 to 62 pct of the time since 2020 and 2023.
My second point is that over the last 2 years, Software and Semis have had the most extreme relative return moves in at least the past 11 years:
- Since 2015, Semis have beaten Software by an average of 2.1 percentage points over any given 50 trading day period. The standard deviation around that mean is 8.6 points.
- In March 2024, Semis outperformed Software by 30 percentage points over the prior 50 trading days, the most extreme reading prior to this year and just over a 3 standard deviation move.
- Subsequently, in December 2024, Software beat Semis by 25 percentage points over the prior 50 trading days, another record and a 3 standard deviation move.
My third point is that over the last 50 trading days, Semis have outperformed Software by 42 points, an all-time high and almost 5 standard deviations above the long-run average.
As tempting as it is to say Software is very oversold relative to Semis and is therefore due for a bounce, we think Software’s unprecedented underperformance suggests that its underlying fundamentals face structural headwinds that don’t support an immediate “reversion to the mean” trade. Semis represent the picks and shovels underpinning the buildout of gen AI. They have sizeable order backlogs and are therefore now seen as the less risky investment option. Whereas software names used to be the more defensive choice due to their recurring cashflows, these companies now face disruption risk from gen AI, thus losing business, and have to spend incrementally on AI to protect their competitive advantage which adds to current expenses. As a result, Semis have gone from having a slight edge over Software in the 2010s to now a meaningful advantage in the current investment environment.
Let’s now move on to our second example of an extreme rotation that’s happening right now, and that’s non-US stocks, which just outperformed the S&P 500 on a dollar-return basis by a statistically very unusual amount. We use the MSCI All-Country ex US index as our proxy for non-US stocks. The ETF symbol is ACWX. This chart shows trailing 50 trading day relative price returns for the S&P 500 and ACWX from 2015 to the present. When the blue line is above or below the x axis, rest of world stocks have out or underperformed the S&P 500 by the number of percentage points noted on the y axis.
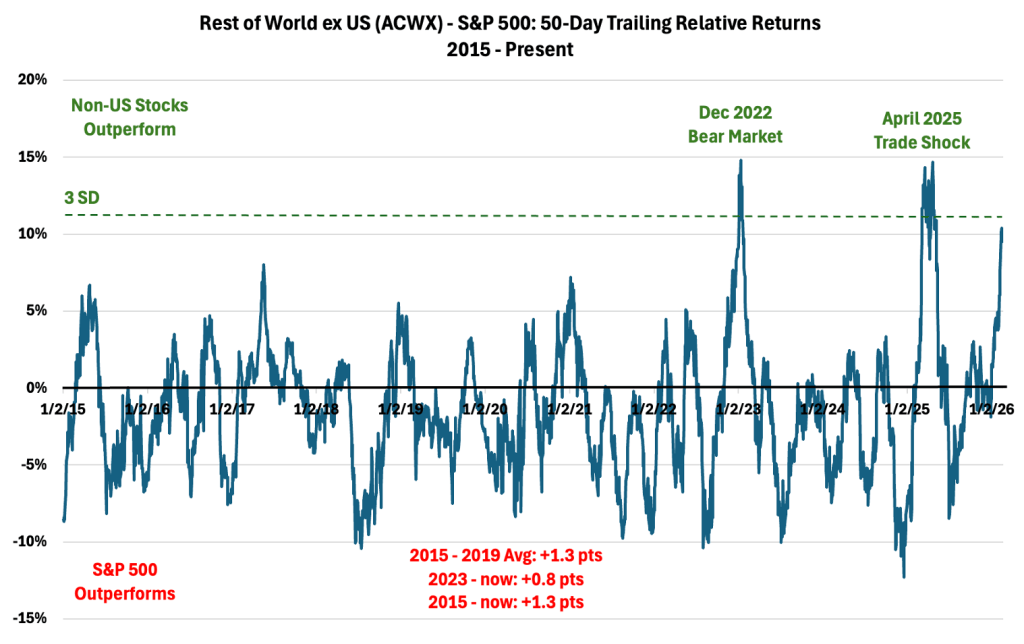
Over the last 50 trading days, rest of world equities outperformed the US by 10 points, just under 3 standard deviations above the long-run average. That’s only happened two other times, which were during 2022’s bear market which disproportionately hurt US Big Tech and then during April 2025’s trade shock.
The upshot is that non-US stocks look very overbought here as investors have pulled capital from US Big Tech and parked it overseas. That said, worries about Big Tech’s AI CapEx spend likely won’t lessen anytime soon, and non-US stocks have a lot of momentum behind them. A weakening dollar also serves as a tailwind for US based investors in international stocks. We therefore think the most prudent approach is to index-weight non-US stocks in global equity portfolios for at least the rest of Q1 2026, a position we have been advocating for many months. The MSCI All Country World index is currently 62 percent US stocks, 5 pct Japan, and the remainder in European and Emerging Market equities.
For our last and third example, US small cap stocks have also just outperformed US large caps to a statistically significant degree. This chart shows trailing 50 trading day relative price returns for the Russell 2000 versus the S&P 500. When the blue line is above or below the x axis, the Russell has out or underperformed the S&P by the number of percentage points shown on the y axis.

I have 3 brief points on this chart:
First, the S&P 500 tends to outperform the Russell 2000 over any given 50 trading days.
- From 2015 to 2019, the gap was relatively small, at an average +0.3 percentage points in favor of the S&P.
- Since 2020, the difference has widened to an average of +0.7 points in favor of large caps.
- Over the entire period or last 11 years, the S&P has outperformed the Russell by an average of +0.5 points over any given 50 trading days.
Second, over the 50 trading days ending January 21st, small cap equities outperformed large caps by 9.4 points, over 2 standard deviations above the long-run average. US small caps have seen this kind of performance or close to it on only 5 occasions since 2015. All this goes to show small caps’ recent outperformance was extremely notable.
Third, since January 21st, the Russell has lagged the S&P 500 by -2.0 percentage points. This is consistent with prior periods just after unusually strong small cap outperformance as there’s usually a reversion to the mean.
The takeaway here is that, once again, capital moved away from US large caps, in this example to US small caps, since this part of the American equity market doesn’t have any US Big Tech exposure. Unless you’re expecting another speculative stock market bubble, history says small caps will keep rolling over relative to large caps.At the same time, investors remain squeamish when it comes to US large cap equities, so we think it’s prudent to index weight US small cap stocks in diversified portfolios. They are currently about 8 percent of the S&P 1500.
To wrap up, our bottom line is that the year-to-date rotation caused by concerns about the size of Big Tech AI investments has created violent moves into previously out of favor groups like US small caps and dramatically extended previous relative gains in non-US equities. Investors have also doubled down on Semis, given that they’re the picks and shovels underpinning the rollout of AI rather than a potential target.
What all three of these rotations tell us is that this is not a random market, but one where investors are repricing the risk of both AI’s cost to develop and its eventual impact on previously stable business models. Capital is moving away from stocks with high valuations and business models with perceived AI risk, and toward companies with more visible cash flows, harder assets, or direct exposure to AI infrastructure.
The 2-, 3-, and even 4-plus standard deviation moves I have shown you today don’t happen in calm, consensus environments. They only occur when investors are reassessing fundamentals based on a combination of new information and incremental uncertainty about the future.
History says extreme moves tend to mean revert. But history also says structural shifts, like the buildout of AI, can extend trends longer than most expect. That’s why we always recommend letting extreme moves settle out for at least a few weeks and until there’s a notable catalyst, as we’ve recommended to our clients for months in the case of software stocks for example.
With that, thank you very much for taking the time to watch this video, please hit the link button and subscribe to our YouTube channel if you enjoyed it. And be sure to check out our website datatrekresearch.com for a free trial to our daily reports on markets, data and disruption. There’s no credit card or personal information required, just drop your email in.
Thanks again for watching and we hope you have a great day!
