



Non-US Stocks: 3 Things You MUST Know in 2026
By datatrekresearch in Blog
In our latest video, DataTrek co-founder Jessica Rabe shares 3 things you need to know about “Rest of World” equities as they continue to outperform US large cap stocks by a wide margin. For example, the MSCI All Country ex-US index is very different from the S&P 500 in key ways. For one, the S&P is structurally tilted towards growth, whereas MSCI All Country ex-US has a pronounced value and cyclical bias. Jessica also shares which group – US or rest of world stocks – we think will outperform over the next decade.
Watch it here on our YouTube channel! Please hit like/subscribe and share this video if you find it useful. Sign up on datatrekresearch.com to sign up for a 2-week free trial to our daily investment newsletter!
Transcript
Hi, I’m Jessica Rabe, one of the co-founders of DataTrek Research. In today’s video I’m going to share 3 things you likely don’t know about non-US stocks but need to, given that they’re outperforming the S&P 500 once again this year and by a wide margin. We use the MSCI All Country ex-US index as a proxy for rest of world equities, and that will be our benchmark for today’s discussion. The ETF symbol is ACWX.
The first point I want to cover is that, when most people think of international investing, their mind goes right to China, India, and maybe Germany since those are all top 5 countries in terms of GDP. This chart shows the country weightings for ACWX, and they are very different from what you might think.
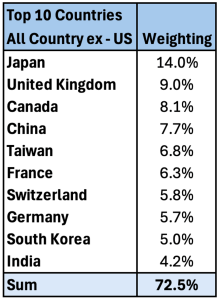
As you can see, Japan has a larger index weighting than China, Taiwan and Canada both surpass India, and the United Kingdom is more heavily weighted than Germany. These examples seem counterintuitive given the relative importance of these countries to the global economy. For example, the Japanese economy is one fifth the size of China’s, and France’s GDP is three times as large as Taiwan’s. These differences are due to a mix of economic history, the types of public companies domiciled in each country, and the relative popularity of equity financing in each nation.
The takeaway here is that non-US equity market indexes like MSCI All Country ex – US reflect the relative size of a given country’s stock market and nothing else. And, because a handful of countries hold most of that value, ACWX ends up fairly concentrated in just 10 of them, totaling almost three quarters of the fund.
The second thing you need to know is that the S&P 500 and MSCI All Country ex-US are unlike each other in two key ways.
First, their sector weightings vary considerably, as this table shows. We have clustered the data here into sectors the S&P 500 overweights relative to ACWX on top and those it underweights on the bottom.

The upshot here is that the S&P 500 has a 17-percentage point overweight to Tech, nearly equal to its underweighting in Financials and Industrials put together. The S&P also has a noticeable underweighting of over 5 points to Materials. In other words, the S&P is structurally tilted towards growth, whereas MSCI All Country ex-US has a pronounced value and cyclical bias.
Second, the S&P is much more concentrated in its top 10 holdings than MSCI All Country ex-US:
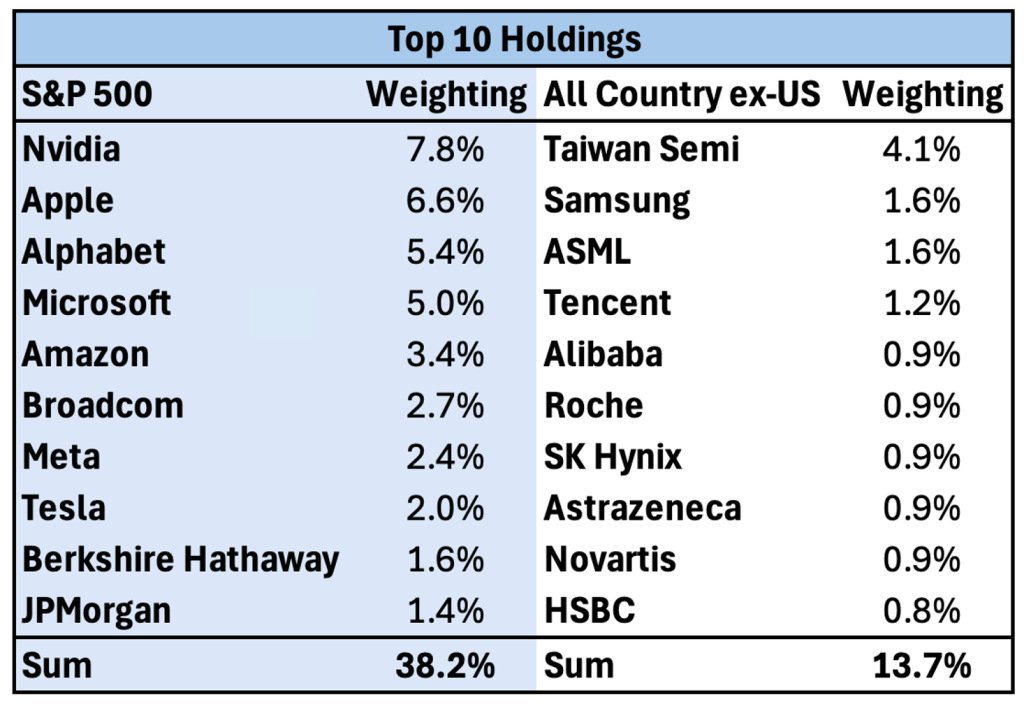
This is where the S&P and rest of world equities really diverge, because the S&P is much more heavily concentrated in its top 10 names at well over a third of the index, whereas ACWX’s top 10 holdings only make up 14 percent of it. Additionally, the S&P’s weighting to US Big Tech including Broadcom is 35 percent, or more than 3 times larger than ACWX’s exposure to its version of mega Cap Tech at just 10 percent of the index.
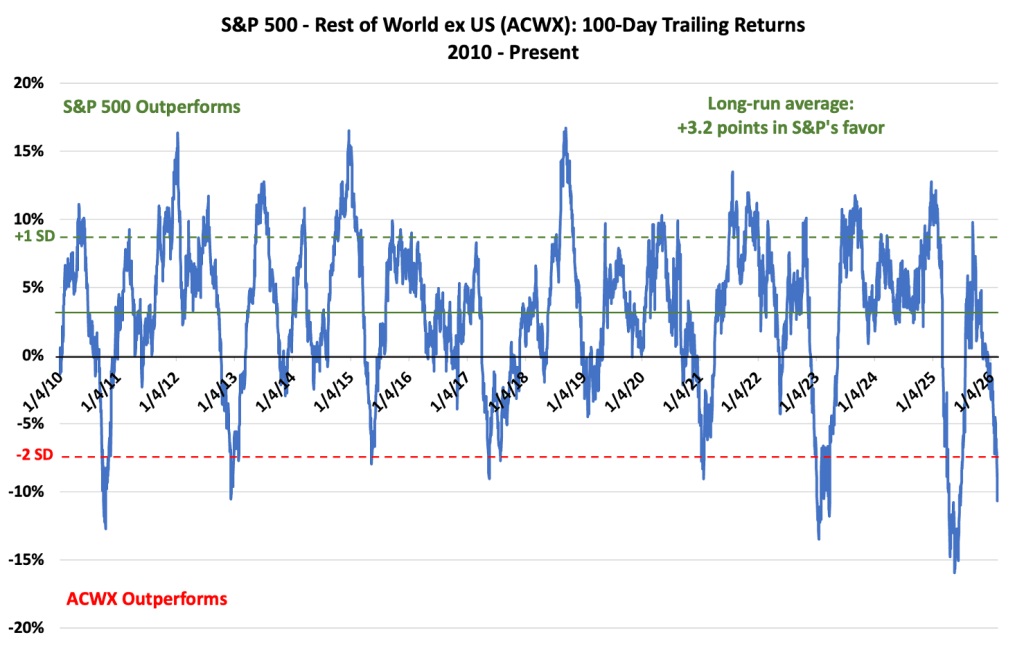
Lastly, the third thing we think you should know is that the relative price performance between the S&P 500 and MSCI All Country ex-US has moved in a very consistent and predictable pattern over the last 15 years even with many exogenous shocks along the way. This chart shows the trailing 100-day relative price returns between US large cap and rest of world stocks from 2010 to the present. When the blue line is above or below the x axis, the S&P has out or underperformed ACWX by the number of percentage points shown on the y axis.
I have 3 quick points on this chart.
- First, the S&P has consistently outperformed rest of world since 2010, although its edge recently has narrowed somewhat.
From 2010 to 2019, US large caps beat rest of world stocks by an average of 3.5 percentage points over any given 100 trading day holding period. From 2020 to the present, that average has been 2.9 points in favor of the S&P. For the entire period, the mean is 3.2 points and the standard deviation around that average is 5.4 percentage points. - Second, relative S&P and rest of world returns run in an asymmetric band, as you can see by the dotted black lines on the chart. S&P 500 outperformance tends to top out at 1 standard deviation or 8.7 percentage points, while rest of world outperformance usually peaks at 2 standard deviations or 7.6 points better than the S&P.
The reason for this asymmetric relationship is largely because of the S&P’s structural outperformance. When rest of world stocks catch up, the rotation tends to happen quickly and in a very pronounced fashion. This has happened 7 times over the last 16 years. - Third, over the last 100 trading days, rest of world stocks have outperformed the S&P by 10.7 percentage points. That’s more than the 2 standard deviation level of 7.6 points that marks the upper end of the historical relative performance band. Per usual, this outperformance came right after a period when US stocks were exceptionally strong, up 10 points or more than 1 standard deviation in September 2025.
Now the purpose of this point isn’t to make a near-term call, but rather to show that despite the recent strong outperformance by rest of world stocks, we still believe the S&P’s long-term performance edge over the MSCI All Country ex-US index is structural. That’s evidenced by the last 16 years, when the S&P beat rest of world stocks 76 pct of the time over any given 100-trading day period.
Also, look at this table with the S&P 500 and ACWX’s 1-, 3- , 5-, and 10-year CAGRs:
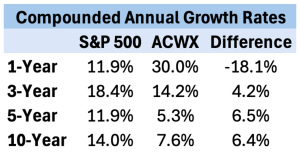
Although the S&P has badly underperformed ACWX over the last year, non-US stocks are clearly also playing some catchup as the S&P’s compounded annual growth rates over the last 3, 5 and 10 years have exceeded ACWX by 4 to 6.5 percentage points. The reason US stocks have outperformed rest of world over the long term is the same as why we think they will continue to do so.US companies leverage disruptive innovation at scale and are laser focused on growth and profitability. Put another way, US markets have globally scalable market leaders with large competitive moats.
Now, I’m going to put up the top 10 holdings in the S&P and ACWX again so you can ask yourself, which basket of companies would you rather own over the next 10 years? While ACWX has some strong top 10 weightings, the US has more major names on the cutting edge of technology. We view the US’s Tech concentration as a long-term feature rather than a bug because disruptive innovation drives long-term equity returns. That’s because investors most consistently underappreciate Tech’s ability to surprise to the upside on earnings, driving the S&P higher.
Now, both indices will look very different in 10 years’ time, of course, which we think only strengthens the case for US equities over the next decade. That’s because the US dominates the global venture capital market, so public markets have a stronger and deeper pipeline of disruptive companies focused on monetizing gen AI.
In fact, the US is increasingly taking share of global venture funding at 64 percent in 2025 versus just 47 to 48 percent from 2019 to 2023. We view venture funding as a “free lunch” for public equity investors because VCs find and fund thousands of potentially disruptive businesses and, while most fail or only generate weak returns, some eventually IPO and mature into large public companies that help drive long-run equity index performance. We’re seeing this virtuous cycle play out now with the largest private companies – SpaceX, OpenAI, and Anthropic – planning to go public this year or next. They will all but certainly list in the US.
With that, thank you very much for taking the time to watch this video, please hit the link button and subscribe to our YouTube channel if you enjoyed it. And be sure to check out our website datatrekresearch.com for a free trial to our daily reports on markets, data and disruption. There’s no credit card or personal information required, just drop your email in.
Thanks again for watching and we hope you have a great day!
