



Jan 2026: Global/US Equity Market Returns
By datatrekresearch in Blog
In our latest video, DataTrek co-founder Nick Colas reviews everything you need to know about how global/US stock markets performed in January 2026 and what these moves signal for the year ahead. The new year has come with some new trends (cyclicals and small caps are hot) as well as the continuation of old themes (weaker dollar, rest of world equity outperformance). We’re still bullish on stocks, and this video explains why January’s market action only strengthens our conviction.
Watch it here on our YouTube channel! Please hit like/subscribe and share this video if you find it useful. Sign up on datatrekresearch.com to sign up for a 2-week free trial to our daily investment newsletter!
Transcript
Hi, Nick Colas from DataTrek here and the topic of today's video is how US and global stocks performed in January. We do a very deep dive on this data every month for our clients and I'll show you a few of the slides that we show them in our monthly review of capital markets.
Let's kick off with what the big macro backdrop was in January. And there's a couple of points here. The first is that US 10-year bond yields rose modestly, eight basis points to 4.24%. And Japan was also higher, as you probably saw in the news, up 18 basis points. But Europe saw lower yields across the board, an average of down six basis points.
Now, US yields were up in the month because inflation expectations were up by 11 basis points. And that's based on 10-year TIPS and real rates were actually down three. So, the reason rates were up in the US is expectations for better economic growth and slightly higher inflationary pressures. Higher yields were not a function of worries about the US Treasury or deficits or geopolitical concerns. It was really strictly due to better expectations for economic growth this year and over the coming years.
The most important thing we saw in the month was very strong gains for non US currencies and that was true both for developed and emerging economy currencies that were up 1.9 and 7% respectively and many European currencies made one-year highs versus the dollar. So the trend that we saw last year of a weaker dollar continued in January.
Now there was a lot of geopolitical uncertainty in the month as you probably recall. We had the conversations about Greenland, new US tariffs, and Iran tensions. We also had a new Fed chair nominee announced as well as another government shutdown on the last day of the month. So January was full of events, full of things that could have unseated capital markets, but they really didn't.
And the next three slides will show you how the month actually played out. This first chart shows you how stock markets performed around the world in January.
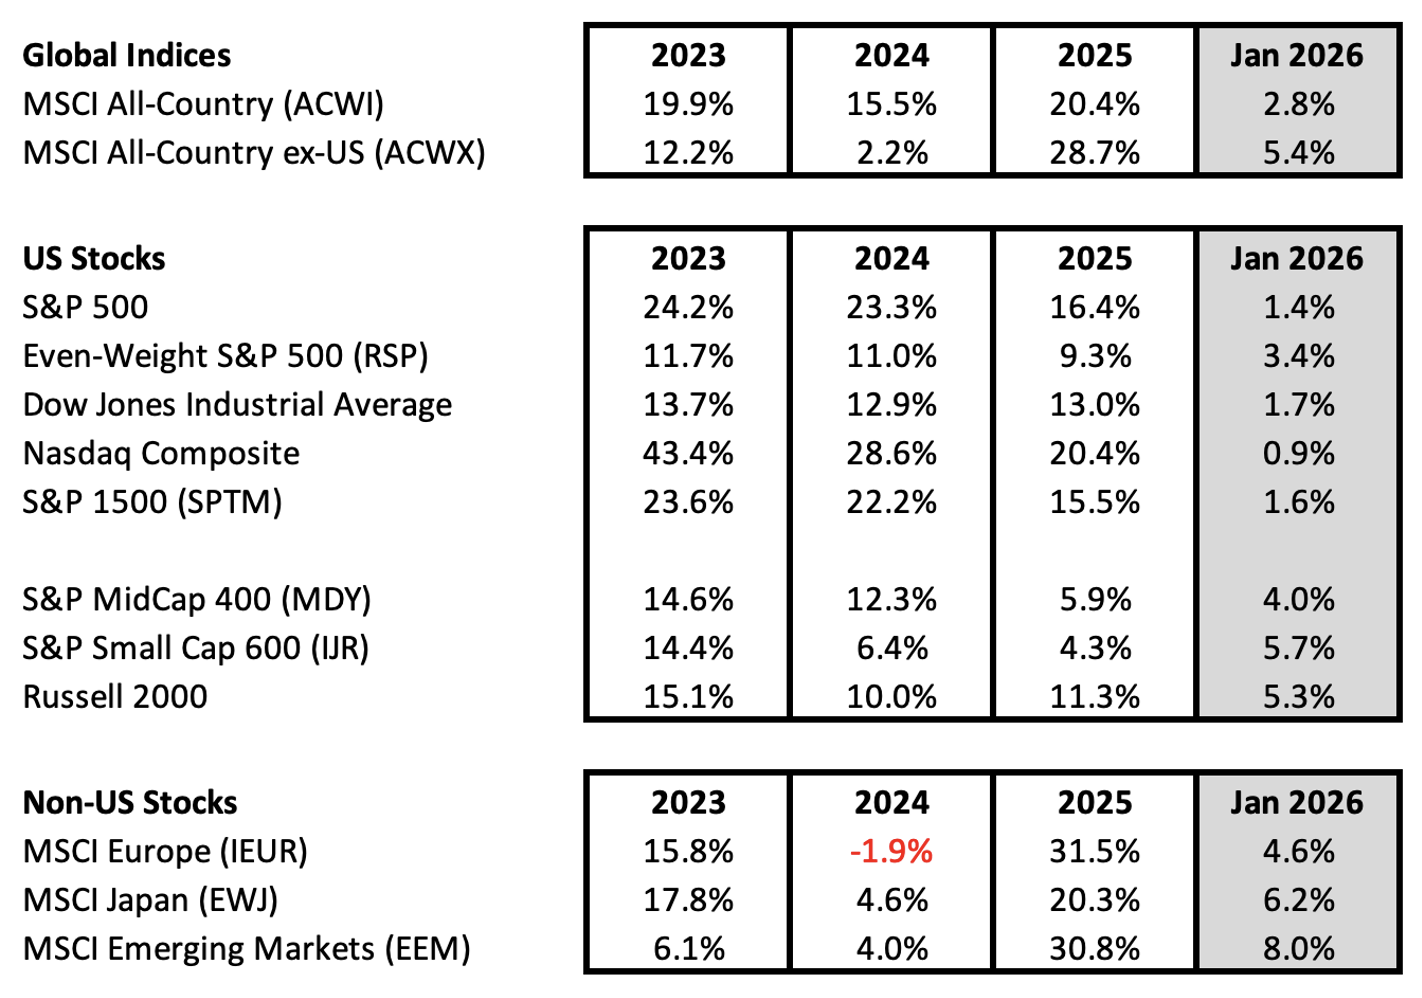
And I'll start by pointing you to the fact that the S&P was up 1.4% on the month. But non- US stocks that MSCI all country ex-US line just below the top was up 5.4% and that's in dollar terms. So those currency effects did help a little bit, but they don't explain the entire gap. So the most important thing about this table is that you saw a very strong non- US stock outperformance in the month of January.
Now why was that? Look at the bottom of the table and you'll see that Emerging Markets were up 8% on the month. Japan was up 6.2% and Europe was up 4.6%. So really it was an across the board rally across different parts of the geographies around the world and really a bit of a move away from the US.
Now, let's not you know overstate the case here. A 1.4% gain for the S&P in the month was quite good. Slightly better than average. And it actually does point to further gains for the year. There's a thing called the January indicator which says that “so goes January, so goes the year”, and it's broadly true. So we have a pretty good signal for US equities.
Now the last thing to mention about this year is the Nasdaq tech stocks. They kind of underperformed. The Nasdaq Comp is only up 0.9% on the year. So, a little bit of a lagard and we'll discuss that a little bit later in the video.
Now, to put this in context, let's look at the returns since 2023 because that's really the length of the current bull market. And we've got those numbers here as well. And you can see that for much of this bull market, 23 and 24, S&P 500 was up 24% and 23% versus just 12% and 2% for non US stocks. And so what you see beginning in 25 when non- US stocks were up 28.7% and the S&P was up 16.4% both very good numbers but it was the first year when non- US stocks really started to outperform in the current bull market and that's really good to see because you want to see overall a bull market that shares the wealth among all different regions.
It shows that confidence in the economies around the world is getting better and that's a really good positive and so we launch off into 2026 with a lot of the same message which is very heartening. We see that non- US stocks are outperforming but everything is basically up. So a good start to the year.
Now let's dig in a little bit deeper and look at some of those non US returns because there's some pretty interesting stories here.

So the table here shows the S&P 500 up 1.4% in the month and Europe broken down by major economies and emerging markets broken down by major economies and you can see Europe was up 4.6%. Now you'll see that the Netherlands was up 9.2%. And you might say, "Wow, what's going on with Dutch stocks? That's pretty cool."
The reality is that 90% of that move of that 9.2% came from ASML which is a very big plus 20% waiting obviously in MSCI Netherlands and was up over 20% in the month. So that push that you see in Dutch stocks really is one stock. It's ASML. The rest of the of the country's indices or stocks did pretty well but that move is really one stock.
Some of the same thing holds true for MSCI United Kingdom which you see is the second best performer in Europe last month up 5%. And that was a combination of a couple of heavyweight names. Specifically, Rio Tinto, HSBC and BP, the old British Petroleum. All of those have pretty heavy weightings, plus 9% in the index. And sorry, plus 3 to 9% in the index. And all of them were up 9 to 11% and that gave you that nice shove in MSCI UK.
So what you see here is good returns by country, specifically several countries. However, very much driven by single stock stories of across a wide array of things. Technology for ASML, financials for HSBC, and industrial/cyclicals like Rio Tinto and BP in the UK. Again, I think it's a very healthy thing because you're seeing rotation not just into some good tech names like ASML, but into other names as well.
And you can tell some of the same story in the Emerging Markets categories. So you'll see that the two best performers really just rocket ships were MSCI South Korea up 26% in the month and MSCI Brazil up 17% in the month. And that's a classic story just like the European stocks where technology specifically Hynix and Samsung did really well for South Korea in January and in the case of Brazil you had oil companies and mining companies outperforming as well.
That's why those two countries’ indices show such strong returns for last month. It obviously helped MSCI Emerging Markets overall but the engine was really these second tier, second weighted countries like South Korea and Brazil not China and to a lesser degree not even Taiwan with Taiwan Semi.
So the message from this table is much the same as the first but at a deeper level. We're seeing rotation into financials cyclicals and some technology names broadening out this rally beyond just the US. Everything's doing well. As I said, the S&P 500 was up 1.4%. Nothing to sneeze at. Nice return. But there's stronger returns outside the US as money flows into these ideas that aren't just US big tech.
The third and final table I want to show you now drills into US large cap sector performance, S&P 500 sector performance for the month of January.

And here you see that 1.4% for the S&P right in the middle. And then the sort of tech heavy groups, technology, consumer discretion, communication services, up between 1.5 and 2%. But the real action last month happens below that S&P line.
It happened for example in energy, which has been a chronic underperformer as you can see all the way back to 2023, but was up 14% in the month because of that move in oil prices that we saw on the Iran tensions. I always tell clients, do not underweight energy. Leave it as an index weight of 3-4% because when it works, it works fast and it's very hard to outperform if you're underweighted that group when it's up 14% in a month like it was in January.
Aside from that, we had a pretty nice rotation into industrials, up 6.7%, which was the only non- tech group to outperform last year and is outperforming so far year to date. Also a nice rotation into materials up 8.6%. And consumer staples which just were horrific last year, one of the worst performing groups in the S&P down 1.2%. Up 7.5% in January on what I think was probably some relief from tax loss selling in December being lifted in January.
So again nice rotation into a lot of non- tech names, a lot of non- tech groups as we start the year which I think is a very healthy sign. So wrapping up, a couple of takeaways here. We've had a very bullish start to the year and that often signals further gains. The second is that non US currencies and equities continue to show a lot of momentum. The dollar does often weaken during multi-year global bull markets as money moves away from the safer equities in the US to more speculative ones particularly in emerging markets as we saw this month.
That healthy rotation to cyclicals I think is very promising because it shows that there's confidence in the global economy not just the US economy or US big tech. So a very healthy sign and although US big tech and tech generally is lagging, it occasionally does that before it rallies again. So I wouldn't give up on tech here.
For example, last year in January big tech contributed nothing to the S&P, it was a wash. Same exact thing happened last month, another wash, and tech underperformed for the whole first quarter before being the best performing group for the entire year of 2025. So tech goes through these phases. I think we're all used to it at this point, but I wouldn't give up on tech just yet.
So the bottom line, January taught us or retaught us, I think, a really important lesson about investing and that's headlines do not drive stock prices. Fundamentals do and fundamentals are quite good right now, not just in the US, but around the world. We're still bullish. still bullish on US and global stocks and January fully supports that view.
Now, the history says February is going to be a little bit flatter, probably like a 0% return if history holds, but March does get better. So, we're still bullish, still positive on stocks. U We very much hope you enjoyed this video. If you did, please hit like and subscribe and be sure to check out our work at datatrekresearch.com and sign up for your 2-week free trial. With that, thanks again for your time and attention and have a great day.
