



Nasdaq Comp: Historical “Year 4” Bull Market Returns
By datatrekresearch in Blog
With the Nasdaq Comp up at least 20% in each of the last 3 years, DataTrek co-founder Jessica Rabe discusses what may happen in 2026. When the Comp rallies for 3 straight years after an annual loss like in 2022, history since the early 70s shows these annual gains have continued into Year 4 two-thirds (67 pct) of the time. The only 2 times the Comp fell in Year 4 were during rate shocks. Year 4 average gains were below the long-run average of +13.5 percent, except for a stellar 4th consecutive double-digit annual gain in the late 1990s. We remain bullish on US large cap Tech.
Watch it here on our YouTube channel! Please hit like/subscribe and share this video if you find it useful. Sign up on datatrekresearch.com to sign up for a 2-week free trial to our daily investment newsletter!
Transcript
Hi, I’m Jessica Rabe, one of the co-founders of DataTrek Research. In today’s video I’m going to share why we think US large cap Tech stocks will continue to rally this year, despite the Nasdaq Composite already more than doubling over the last 36 months. The key thesis behind this bullish stance is simple. It is very difficult for investors to accurately predict the future of disruptive technologies, then forecast their profit potential and, finally, assess the correct valuation for those earnings.
The market is usually too conservative on all 3 counts, which is why the Comp has such a strong long term track record. Of course, there have been instances when the market overestimates some or all these factors, and I’ll discuss the warnings signs of such overoptimism as well.
Now is exactly the right time to discuss this topic, because the Nasdaq has just had 3 straight years of at least 20 percent gains, with the index up 43 percent in 2023, 29 percent in 2024 and 20 percent in 2025 on a price basis.
So as for why the Comp should still have more gas in the tank, I have three points:
The first is that the most common duration of a bull market for the Nasdaq – which we define as one or more years of positive price returns after a down year – is two years, as shown in this table. This framework is relevant just now because the last 3 years of above average returns came after a terrible 2022, when the Nasdaq fell by 33 percent. Our approach of measuring historical sequential gains only after an annual loss is therefore consistent with that experience.

I have two comments on this table. First, history shows that it’s most common for the Nasdaq Comp to rally for 3 to 6 straight years after a down year. That has happened 6 times since the index launched in 1970. Two-year rallies have only occurred 4 times.We excluded the current bull market since we don’t yet know how long it will last.
Second, since 2025 marked the third positive annual return for the Comp after 2022’s losses, history says the index will likely rally for another 2 or 3 years. That’s because it’s more common for the Nasdaq to advance for 5 to 6 straight years after a down year – happening 4 out of 6 times – than 3 years, having happened just 2 out of 6 times. In other words, the index has never stopped at rallying for just 4 consecutive years.
As I alluded to at the beginning of this video, there are good fundamental reasons for these streaks. Just think about how far technology has come since 1970, when the only computers were mainframes, cell phones were still years away, and the Internet’s predecessor would not be invented for over a decade. It takes markets many years to even remotely come close to discounting developments like these, so the Tech-heavy Nasdaq trends to go long stretches without an annual loss.
Now let’s move on to our second point, which focuses on Year 4 returns since that is where we find ourselves in early 2026. For the sake of completeness, we will consider historical periods BOTH when the Comp continued to rally AND years when a 3-year straight annual gain then led to a loss for the index. There have been a total of 6 such years since 1970 (again excluding the current bull market), with 2 posting losses and 4 giving the Comp its fourth straight year of gains. The table below shows those years and their price returns, with losses in red and above average winning years in green:
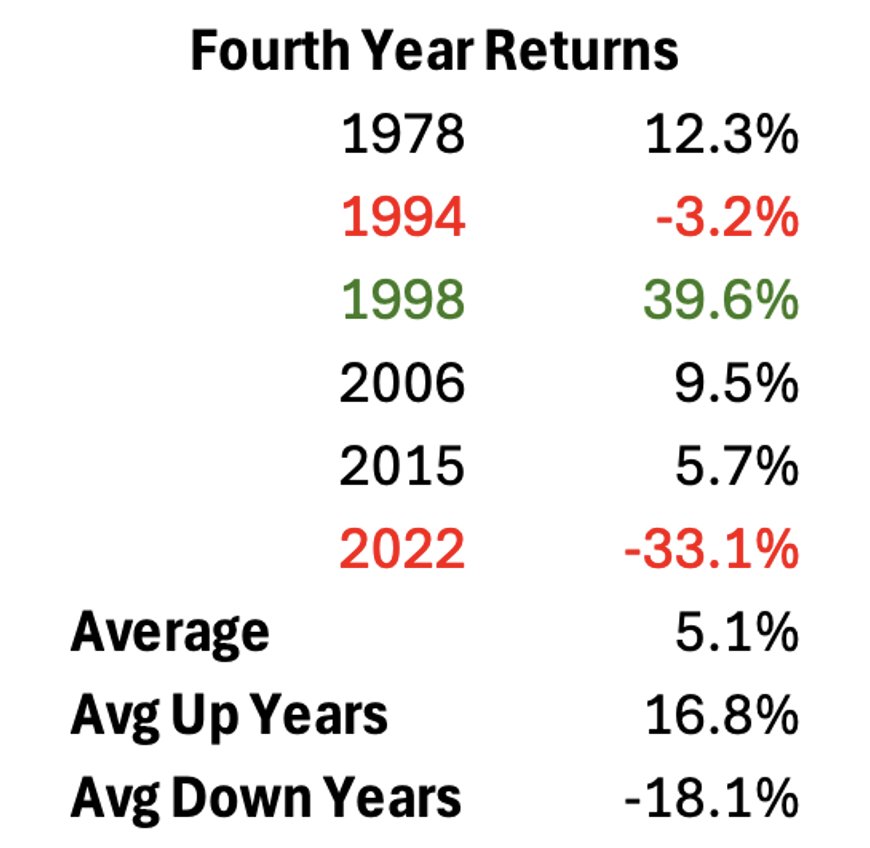
I have 3 comments on this table. The first is thatbased on the historical data, the odds of the Nasdaq Comp registering a fourth year of gains after a sequence of three consecutive up years is 67 percent, since 4 out of 6 years were up. The average Comp price return for all these years is positive 5.1 percent, but it is skewed lower by 2022’s bear market when the index fell by 33 percent.
Second, when you exclude the 2 losing years (1994 and 2022), the Comp’s average annual price return in Year 4 is positive 16.8 pct, above the long run average of positive 13.5 percent. That mean return is skewed higher by 1998, however, when the comp gained 40 percent, with the remaining 3 out of 4 years generating below average gains of 6 to 12 percent. A below average return in Year 4 does make sense given that the market does eventually get closer to accurately discounting even dramatic increases in computing power and the corporate profits they generate.
Third, loss making Year 4s have been due to a market shock caused by an unexpected shift in US monetary policy:
- In 1994, the Nasdaq lost 3.2 pct because of a surprise series of Fed rate increases after a period of low rates in the early 1990s.
- In 2022, the Comp declined by 33.1 percent, also caused by an unexpected and very aggressive sequence of rate hikes after the Pandemic Era’s zero percent short term interest rates.
History therefore suggests the Nasdaq Comp should continue to rally this year, barring an exogenous shock like an unforeseen change in Fed rate policy. There will be pullbacks, just like in every bull market and as we saw last year. But we view those drawdowns as buying opportunities and remain bullish on US large cap Tech. The 90s may be an uncomfortable comparison given the eventual bubble back then, but it also shows the pain of selling too early and missing out on tremendous gains from a secular growth theme rooted in a truly disruptive technology.
Our third and final point is that the Nasdaq Comp has only had a positive annual return of at least 20 percent in 3 sequential years on 2 other occasions since the early 70s. However, current macro conditions around this latest streak are similar to only 1 of those instances, when the Nasdaq’s run lasted much longer than the other.
The prior two times this happened were after:
- 1994’s -3.2 percent loss. The Comp went on to rally more than 20 percent for 5 straight years from 1995 through 1999 before the Dot Com Bust in 2000.
- The second time was after 2018’s 3.9 percent loss, with the Nasdaq up more than 20 pct for 3 years in a row before 2022’s Fed rate shock.
The upshot here is that the current bull run is much more like the back half of the 90s than 2019 to 2021. Just like in the former period, the latest rally has come after a rate shock that didn’t cause a recession and, on top of that, we have a new disruptive technology in Gen AI. That was not the case in the very early 2020s.
Additionally, unlike in 2022, the Fed is currently in a rate cutting cycle. That means the only macro worry outside of an exogenous shock is a reemergence of inflation, which is not our base case.
I’m going to now wrap up by saying we do not yet think there is a broad AI stock market bubble and we’re not even close to one. We have a simple rule of thumb that “a double is a bubble”, but the Nasdaq is still far from having doubled within a year. While it rose 20 percent last year after 2 prior years of strong gains, the Comp gained 86 percent in 1999 alone– almost a double – after 4 straight years of sequential 20 percent rallies.
Hindsight is always 20 20, but that huge of an annual gain was clearly a red flag. Markets rarely get assumptions about earnings growth so wrong that stocks justifiably double or almost double within a year.
With that, thank you very much for taking the time to watch this video, please hit the like and subscribe buttons if you enjoyed it. You can read our daily investment newsletter by signing up for a 2-week free trial on our website datatrekresearch.com.
Thanks again for watching and we hope you have a great day!
