


US Income Inequality: Latest Data
By datatrekresearch in Blog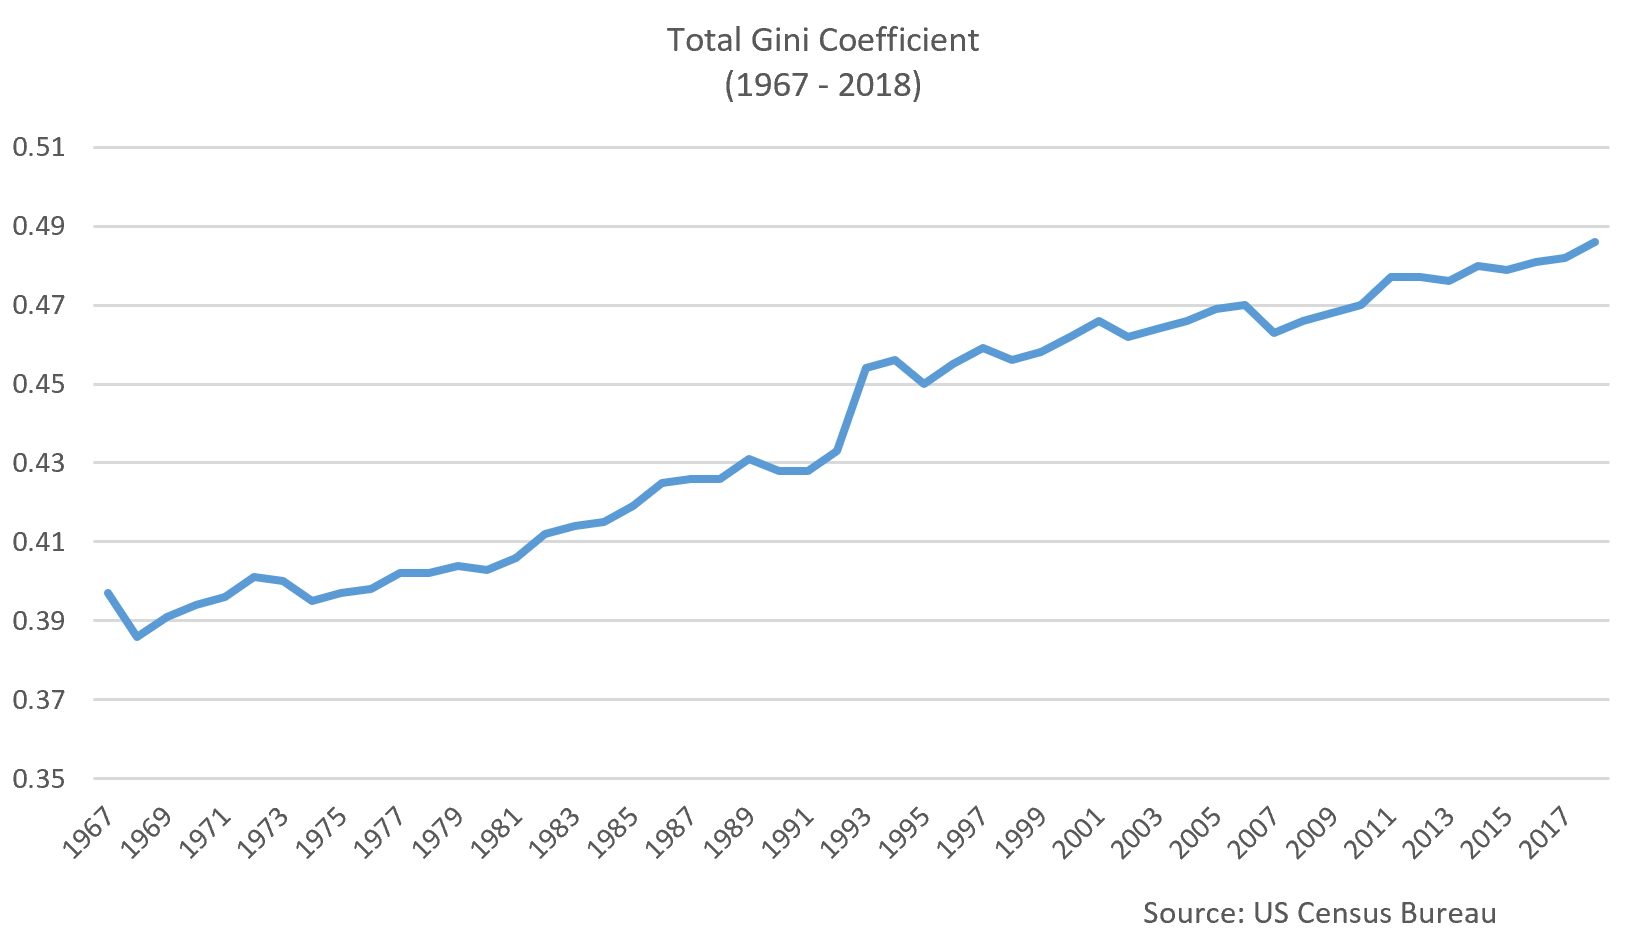
Today the US Census Bureau released its latest data on local-level income, poverty and health insurance statistics from its American Community Survey. For data nerds like us this is sort of like Christmas in September, so let’s look at the highlights:
- Real median household income was up 0.8% in 2018 from the prior year to a new record of $61,937.
- Income inequality, however, rose in 2018. The 2018 Gini Index (where 0 is no inequality and 1.0 is all income to one household) was 0.485, up from 0.420 last year.
- The poverty rate increased in only one state: Connecticut. None of the 25 most populous metro areas saw an increase in poverty in 2018. An earlier Census Bureau report put the national poverty rate at 11.8% in 2018, down 0.5 points from 2017.
- The same earlier report put the percent of Americans with health insurance at 91.5% in 2018, down from the prior year’s 92.1%. Today’s release pinpoints Wyoming, South Carolina and New York as the states with the largest declines in insured Americans.
Since most of the press commentary related to this release centered on the rise in income inequality, let’s dig a little deeper there:
- Most of the country’s high Gini coefficient (0.485 comps to Europe’s 0.307, for example) is concentrated in 5 states: California, Connecticut, Florida, Louisiana and New York. DC and Puerto Rico also have higher-than-national level Gini coefficients.
- The remaining 35 states have lower than national average Gini coefficients.
- In 2018, income inequality grew in 9 states (and not necessarily the ones you’d think): Alabama, Arkansas, California, Kansas, Nebraska, New Hampshire, New Mexico, Texas and Virginia.
The upshot here is that rising income inequality is a broad geographic phenomenon across the US. Yes, it got worse in California this year (but not New York) but it also increased across the heartland, deep South and Western states.
Now, putting this data into a historical perspective: as the 1967 – present chart above clearly shows, America has seen rising income inequality for decades. About the only thing that slows down this trend is recession, but once the US economy starts to grow again so does the Gini coefficient.
| The upshot to all this: income inequality is much in the news and will no doubt be part of the upcoming US election cycle discussion, but history shows it is a powerful long-term trend. Source: https://www.census.gov/newsroom/press-releases/2019/acs-1year.html |
